

Dewey Wu General Manager & senior mechanical engineer at EPOC CRAFTER, 15 years in design engineering, quality, and metallurgy. Hands-on across CNC machining, metalwork, sheet metal, and prototyping (subtractive + 3D printing).
Compressive stress is the force acting on a material in compression divided by its original load-bearing cross-sectional area, calculated as σc = F/A₀. When force is measured in newtons and area in mm², stress is expressed in MPa.
For plastic parts, this nominal stress does not tell you whether the part can safely carry the load. You also need material compression properties, loading conditions, contact geometry, and checks for yielding, local crushing, buckling, and time-dependent deformation. ASTM D695-26 and ISO 604:2002 provide methods for measuring plastic compression properties, but neither establishes the load capacity of a finished component on its own.
1. What Is Compressive Stress?
Compressive stress describes the internal force per unit area developed when a material is subjected to a squeezing or pushing load. In a plastic component, it can arise between clamping surfaces, under a mounting bracket, or where a spacer transfers force between two mating parts.
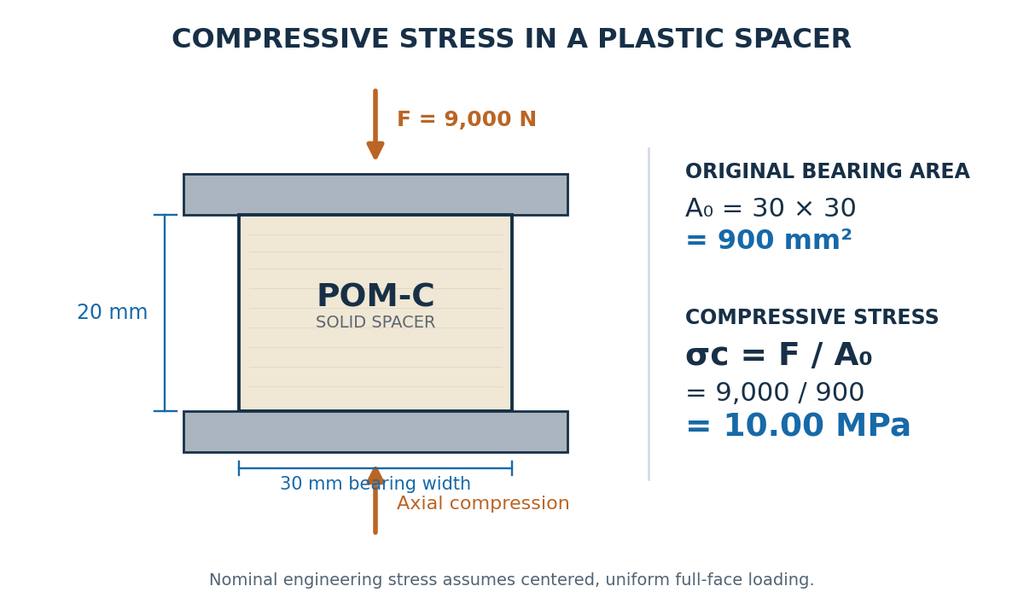
Consider a solid plastic spacer compressed between two steel plates. As the plates push toward each other, the spacer shortens along the loading direction and may expand laterally. The compressive stress depends on the applied force and the original cross-sectional area carrying that force.
For a uniformly loaded section, engineering compressive stress is calculated using the original area, A₀. It is not calculated from the changing cross-sectional area during deformation. ASTM D695-26 and ISO 604:2002 use this nominal stress basis when determining plastic compression properties.
Compressive stress and compressive strain describe different responses:
- Compressive stress (σc): The applied compressive force divided by the original cross-sectional area, expressed in MPa.
- Compressive strain (εc): The reduction in the specimen’s gauge length divided by its original gauge length, expressed as a ratio or percentage.
In compression testing, shortening is commonly reported as positive strain. Some structural analysis conventions assign a negative sign to compression. The sign convention must remain consistent when comparing calculations, test reports, and FEA results.
The broader stress vs strain distinction helps explain why load intensity and material deformation must be evaluated separately, although tensile and compression test results are not interchangeable.
A uniform axial load produces a nominal average stress. Actual stress within a finished part can vary around holes, ribs, contact edges, or eccentric loading points. Even a solid spacer with flat bearing faces may experience uneven contact pressure when the mating surfaces are not parallel.
2. Compressive Stress Formula and Calculation
The compressive stress formula relates an axial load to the original cross-sectional area resisting that load:
σc = F / A₀
Where σc is engineering compressive stress (MPa), F is applied axial compressive force (N), and A₀ is original load-bearing cross-sectional area (mm²). Since 1 N/mm² equals 1 MPa, stress can be calculated directly in MPa using newtons and square millimeters.
For a solid rectangular section: A₀ = b₀ × t₀.
For a solid circular section: A₀ = πd₀² / 4.
Use the cross-sectional area perpendicular to the compression direction. For a part containing holes, pockets, or other interruptions in the load path, the gross external area may not represent the section carrying the load. Local stress and contact conditions may require a separate assessment.
2.1. Calculating Stress in a Loaded Plastic Part
Consider a solid POM-C compression spacer used to transfer axial clamp force between two steel bearing faces in an industrial assembly. The case uses these design inputs:
| Parameter | Value |
| Material | Ensinger TECAFORM AH natural, POM-C |
| Manufacturing route | CNC machining from extruded stock |
| Nominal dimensions | 30 × 30 × 20 mm |
| Compression direction | Along the 20 mm dimension |
| Original bearing area | 900 mm² |
| Normal compressive load | 9,000 N |
| Maximum design load | 13,500 N |
| Linear elastic design modulus | 2,500 MPa |
The spacer has a solid rectangular load path with no holes or pockets. The calculation assumes centered axial loading and uniform contact across the full 30 × 30 mm bearing face.
At the normal operating load, σc = 9,000 / 900 = 10.00 MPa. At the maximum design load, σc = 13,500 / 900 = 15.00 MPa. Nominal stress increases by 50% because the load rises by 50% while the original bearing area remains constant.
Under a small-strain linear elastic assumption:
εc = σc / Ec
δ = FL₀ / (A₀Ec)
The distinction between modulus of elasticity and component stiffness is important here: material response, geometry, and boundary conditions jointly determine displacement, while tensile and compressive moduli must not be assumed identical.
Here εc is calculated compressive strain, Ec is the compressive modulus used in the model (MPa), δ is axial shortening (mm), and L₀ is original compression length (mm).
| Calculated response | Normal load | Maximum load |
| Applied force | 9,000 N | 13,500 N |
| Nominal compressive stress | 10.00 MPa | 15.00 MPa |
| Compressive strain | 0.400% | 0.600% |
| Axial shortening | 0.0800 mm | 0.1200 mm |
At 13,500 N, the calculated instantaneous shortening is 0.1200 mm, below the case’s design limit of 0.150 mm. This meets the displacement target under the stated model assumptions. The 2,500 MPa modulus is a design input, not a measured compressive modulus for the supplied material batch. Actual response depends on material behavior, platen alignment, contact pressure, and loading duration.
3. Compressive Stress vs Strength, Yield and Modulus
Calculated compressive stress describes the loading applied to a cross-section. It does not establish when the material will yield, fail, or deform beyond an acceptable limit. Engineers must distinguish applied stress from properties measured through compression testing.
| Property | What It Measures | Engineering Use |
| Compressive stress | Applied force divided by original area | Calculates nominal stress under load |
| Compressive yield stress | Stress at the defined onset of yielding | Evaluates the onset of significant permanent deformation |
| Compressive strength | Maximum engineering stress reached in a specified test | Characterizes peak response under reported conditions |
| Compressive modulus | Stiffness derived from compression stress and strain | Estimates deformation under appropriate conditions |
| Stress at break | Engineering stress at observed fracture | Describes fracture when a distinct break occurs |
A plastic may yield and continue deforming without clear fracture. Compressive yield stress, maximum compressive strength, and stress at break need not be equal. Each result also depends on specimen geometry, speed, temperature, conditioning, and measurement method.
3.1. Reading the Compression Stress Strain Curve
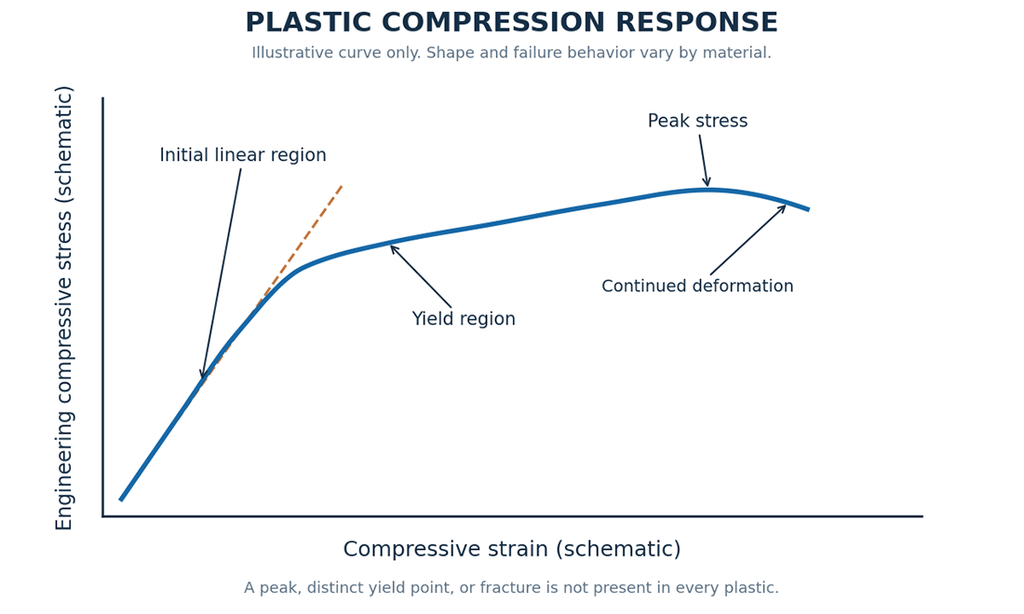
A compression stress strain curve plots engineering compressive stress against compressive strain as a specimen shortens.
Initial elastic response. At small strains, the relationship may be approximately linear. The slope describes the material’s compressive elastic stiffness. Higher compressive modulus indicates less elastic strain at equal stress when test conditions are compatible. It does not necessarily imply higher compressive strength.
Compressive yielding. Some plastics show a recognizable yield point while others do not. When a distinct point is absent, a defined offset yield stress or stress at specified strain may be more useful. The offset criterion must be stated; no universal 0.2% offset criterion should be assumed for every plastic.
A tensile stress-strain curve also distinguishes elastic response, yielding, and ultimate strength, but its measured properties cannot be substituted directly for compression test results.
Maximum compressive stress. Compressive strength represents the maximum engineering compressive stress recorded under the chosen method. It does not necessarily indicate fracture. If the specimen reaches the termination strain without a distinct maximum, stress at termination should not automatically be described as a measured maximum strength.
Permanent deformation and failure. Beyond the initial elastic response, a specimen may develop permanent shortening, lateral bulging, cracking, shear deformation, or localized crushing. These effects must be distinguished from specimen buckling, which can compromise the intended uniaxial material measurement.
3.2. How ASTM D695 and ISO 604 Define Compressive Modulus
The methods have different modulus procedures:
| Test method | Compressive modulus determination | Interpretation |
| ASTM D695-26 | Initial linear compression stress strain response under the prescribed tangent approach | Address seating and toe-region effects |
| ISO 604:2002 | Secant modulus between 0.05% and 0.25% compression strain | Use the specified strain interval |
For ISO 604:2002, Ec = (σ0.25% − σ0.05%) / 0.002, because the strain difference is 0.0025 − 0.0005.
ASTM D695 compressive modulus and ISO 604 compressive modulus use different procedures. The distinction from volume change under hydrostatic pressure is explained by bulk modulus under hydrostatic pressure.
3.3. Which Property Matters for Plastic Part Design?
The POM-C spacer carries a maximum design load of 13,500 N over 900 mm², giving a calculated nominal stress of 15.00 MPa. Whether it remains serviceable depends on the failure criterion.
- Elastic shortening: Use an appropriate compression modulus and relevant material condition.
- Permanent deformation: Examine yield response and unloading recovery.
- Cracking or crushing: Check strength or failure data and local contact conditions.
- Long-term dimensional stability: Assess creep under the actual temperature and loading duration.
- Structural stability: Evaluate geometry, restraint, and possible instability modes separately.
Where contact or combined loading introduces substantial shear deformation, shear modulus and the relevant directional material properties may also be needed beyond the uniaxial compression model.
The calculated instantaneous shortening of 0.1200 mm meets the 0.150 mm limit under the assumed model. It does not establish material yield strength, long-term deformation, or functional test performance.
4. How Plastic Compression Testing Works
Compression testing measures a plastic specimen’s response to increasing axial load. The testing machine records force and deformation, allowing calculation of stress, strain, modulus, and applicable strength or yield quantities. Specimen geometry, loading speed, alignment, conditioning, and strain measurement can change the reported values.
ASTM D695-26 and ISO 604:2002 provide methods for measuring plastic compression properties; neither automatically establishes the allowable load of a finished component.

4.1. ASTM D695-26 vs ISO 604:2002
| Test parameter | ASTM D695-26 | ISO 604:2002 |
| Main application | Rigid plastics | Rigid and semi-rigid plastics |
| Stress calculation | Force divided by original cross-sectional area | Force divided by original cross-sectional area |
| Specimen geometry | Rectangular or cylindrical specimens depending on property | Geometry defined for the applicable specimen and property |
| Compressive modulus | Prescribed initial linear tangent approach | Secant modulus from 0.05% to 0.25% strain |
| Loading speed | Normally 1.3 ± 0.3 mm/min, subject to method provisions | Depends on property, length, and applicable specification |
| Conditioning | ASTM D618 unless otherwise specified | Applicable material specification or ISO 291 |
| Strain measurement | Appropriate compressometer or validated correction | Appropriate strain measurement and correction |
Always report the method and edition. Results labeled compressive strength should not be compared merely because they share the same units.
4.2. Specimen Geometry and Preparation
Specimen dimensions help ensure the test measures material response rather than unwanted structural instability. ASTM D695-26 specifies different common lengths for compression strength and modulus or offset yield testing.
For common rectangular specimens with a 12.7 × 12.7 mm cross-section, a 25.4 mm length is used for strength measurements and a 50.8 mm length for modulus or offset-yield measurements. Comparable cylindrical geometries use a 12.7 mm diameter with the applicable length. These are test specimen configurations, not mandatory dimensions for finished components.
ISO 604:2002 prescribes geometry according to the test objective and specimen configuration, including measures to reduce buckling effects.
Prepare and inspect specimens for damage, cracks, voids, burrs, and bearing-face defects. End-face misalignment can introduce bending during nominally axial compression. Record orientation relative to extrusion, mold flow, reinforcement, or FDM build direction where relevant.
The POM-C spacer’s actual product dimensions of 30 × 30 × 20 mm must not be reported as the geometry of an ASTM D695 standard coupon.
4.3. Loading Speed, Conditioning and Alignment
Under the general ASTM D695-26 procedure, the nominal test speed is 1.3 ± 0.3 mm/min, subject to its method-specific provisions. ISO 604:2002 prescribes speed according to the property measured, specimen length, and relevant material requirements. The selected speed must be documented rather than inferred from the reported result.
ASTM D695-26 references ASTM D618 for conditioning unless otherwise specified. ISO 604:2002 uses the applicable material specification or relevant standard atmosphere provisions. A 23 °C and 50% relative humidity reference environment does not mean that every polymer has the same required conditioning duration.
Use aligned compression platens and record actual contact conditions. Platen friction can restrict lateral expansion near specimen ends and produce barreling; eccentricity and nonparallel faces can produce bending. Platen requirements used for laboratory testing are not universal finished-part manufacturing tolerances.
4.4. Strain Measurement and Compression Test Accuracy
A compression testing machine records crosshead travel, which is not necessarily specimen compression. The machine and fixtures deform, while initial seating can create a toe region at the start of the load displacement curve. Using uncorrected crosshead travel may distort strain and compressive modulus.
For modulus measurement, use an appropriate specimen-referenced compressometer or a validated displacement and compliance-correction approach. Identify the measurement device, gauge length, calibration status, zeroing procedure, and correction method. A smooth curve alone does not establish strain measurement accuracy.
4.5. What a Compression Test Report Must Include
| Report field | Information to check |
| Material identification | Polymer, exact grade, reinforcement, supplier, batch |
| Test standard | Number, edition, property procedure |
| Specimens | Measured dimensions, preparation, original form |
| Orientation | Stock or process direction and load direction |
| Conditioning | Temperature, humidity, duration, moisture state |
| Equipment | Machine, load cell, fixture, calibration |
| Loading procedure | Speed, preload, alignment, contact treatment |
| Strain measurement | Instrument, gauge length, compliance correction |
| Results | Individual curves, modulus, yield and strength as applicable |
| Statistics | Valid count, individual results, average, variability |
| Observations | Yielding, cracking, barreling, crushing, instability |
| Traceability | Report identifier, test date, responsible laboratory |
The same need to control specimen orientation, strain measurement, and manufacturing history arises in tensile stress testing of printed plastics, although tensile and compressive properties require separate interpretation.
Distinguish coupon measurements from finished-part functional tests. For the POM-C spacer, a calculated 15.00 MPa nominal stress is not proof that a real component meets its displacement, contact, or creep requirements.
5. Compression Failure Modes in Plastic Parts
A plastic part can become unacceptable before reaching its material’s published maximum compressive strength. The controlling condition depends on geometry, contact, loading duration, temperature, and material behavior.
| Failure mode | What happens | Engineering check |
| Compressive yielding | Irreversible deformation develops | Yield response and residual deformation |
| Local crushing | Concentrated bearing pressure damages the contact region | Local pressure and contact inspection |
| Cracking or splitting | Cracks initiate or propagate | Material condition and damage observations |
| Structural buckling | A loaded member loses stability | Geometry, end restraints, imperfections |
| Creep deformation | Shortening increases during sustained loading | Duration and temperature-dependent data |
5.1. Material Yielding and Local Crushing
Compressive yielding need not produce visible cracks. A plastic spacer can shorten permanently and become unsuitable for maintaining a fixed clamp position while remaining intact.
Local crushing is different. A steel washer acting on a plastic boss may load a smaller contact region than the boss’s gross cross-section. Contact at an edge, surface misalignment, or insufficient bearing area can produce local deformation not captured by nominal uniform stress. For molded mounting bosses, the injection molding design guide provides related guidance on boss walls, supporting ribs, and geometry that must be considered alongside local bearing pressure.
5.2. Cracking, Splitting and Compression Test Failure
Some plastics yield and continue deforming; others crack, split, or develop shear-related damage. A reported maximum, yield, or break stress may refer to a different event. Neither ASTM D695-26 nor ISO 604:2002 makes maximum compressive stress synonymous with fracture stress.
Inspect abrupt geometry changes, holes, narrow sections, and loaded edges. Their local response may differ from that of a uniform material test specimen.

5.3. Structural Buckling vs Material Compression Failure
Buckling is a structural stability failure. For an ideal straight slender member under elastic axial compression, Euler’s critical load is:
Fcr = π²EI / (KL)²
Fcr is ideal critical load (N), E is applicable elastic modulus (N/mm²), I is second moment of area (mm⁴), L is unsupported length (mm), and K is the end-restraint effective-length factor. This is a structural mechanics relationship, not a universal plastic compression-strength equation.
The POM-C spacer is 30 × 30 × 20 mm and is loaded along its 20 mm dimension. Its nominal length-to-width ratio is 20 / 30 = 0.667. It behaves as a short solid compression block rather than an ideal slender Euler column. That does not rule out bearing damage, lateral expansion, yielding, or unfavorable contact conditions.
5.4. Creep Under Sustained Compression
Plastics may continue deforming under constant load. Creep depends on grade, stress, temperature, duration, and material condition. Short-term modulus does not determine long-term dimensional stability. The discussion of polypropylene creep illustrates why sustained loading and service temperature must be considered separately from short-term stiffness; its material-specific behavior should not be transferred to POM-C.
For the POM-C spacer, the calculated instantaneous shortening at 13,500 N is 0.1200 mm against a 0.150 mm limit. The numerical difference of 0.0300 mm is not a verified allowance for creep, contact deformation, variation, or manufacturing error. Sustained-load acceptance requires a defined hold time, temperature range, displacement or residual-set criterion, and relevant evidence.
6. Manufacturing Effects on Compressive Performance
Two plastic components in the same polymer family can behave differently because manufacture changes material orientation, residual stresses, internal structure, and contact geometry. The process name alone does not determine compressive strength.
| Manufacturing process | Compression-related variables | Verification focus |
| CNC machining | Stock extrusion axis, grade, machining defects, contact-face accuracy | Lot identity, orientation, dimensions, compression data |
| Injection molding | Flow, weld lines, voids, fiber orientation, molding conditions | Representative molded specimens, process records |
| FDM/FFF 3D printing | Build direction, interfaces, raster, perimeters, infill and voids | Build parameters and orientation-specific tests |
6.1. CNC Machined Plastic Parts
CNC machining removes material from manufactured stock but does not erase its extrusion or casting history. Directional material behavior may be relevant, depending on the exact grade and stock form. Face parallelism, flatness, machining damage, and contact area also matter.
The case spacer specifies Ensinger TECAFORM AH natural machined from extruded stock and loaded along its 20 mm thickness. Engineers must identify the original extrusion axis before applying orientation-sensitive stock test data. Finished bearing faces and dimensions also require inspection. The component manufacturing route uses CNC machining of POM components.
6.2. Injection Molded Plastic Parts
Flow, packing, cooling, and solidification affect molecular and, where present, fiber orientation, weld-line position, voids, and residual stress. A material data sheet from separately molded or machined coupons does not establish behavior at every position within a finished molded part.
The injection molding materials guide provides a resin-selection framework for comparing grade-specific properties, shrinkage, and processing considerations before validating compression-loaded molded features.
For a load-bearing mounting boss or support, verify exact resin and reinforcement, load direction relative to fiber and flow, local geometry, and representative part performance. The applicable manufacturing controls are covered in injection molding material properties and rapid injection molding process requirements.
6.3. FDM 3D Printed Plastic Parts
FDM/FFF deposits thermoplastic roads in layers. Load direction, bonding, voids, outer perimeters, raster, infill geometry, and temperature history influence the printed structure. Compression perpendicular to layers does not necessarily fail in the same way as tension across layer interfaces.
Infill percentage alone cannot predict compressive strength. Two parts with equal nominal infill percentages can differ because their walls, bonding, raster, and loading orientations differ. For a load-bearing print, retain material and process records and test specimens or parts representative of the intended build. The manufacturing process is covered under additive manufacturing process controls.
6.4. Can Compression Data Be Transferred Between Processes?
Do not automatically transfer compression results from a machined specimen to an injection molded or printed part simply because the polymer family matches. Compare exact grade, formulation, stock or feedstock state, process orientation, test axis, temperature, and measurement method.
Changing manufacture does not change σc = F/A₀. It can, however, change local stress distributions and the material response that determines whether the component is acceptable.
7. Engineering Case: From Applied Load to Part Verification
A solid POM-C spacer in a bolted industrial assembly demonstrates the difference between calculated nominal compression and validated part performance. It transfers force between flat steel bearing faces, with a 9,000 N normal load and a 13,500 N maximum design load. The specified instantaneous shortening limit is 0.150 mm at the maximum load.
7.1. Component Geometry and Compression Load
| Engineering parameter | Case data |
| Component | Solid compression spacer |
| Material | Ensinger TECAFORM AH natural, POM-C |
| Manufacturing route | CNC machining from extruded stock |
| Nominal dimensions | 30 × 30 × 20 mm |
| Compression direction | Along 20 mm dimension |
| Nominal bearing area | 900 mm² |
| Normal operating load | 9,000 N |
| Maximum design load | 13,500 N |
| Design modulus input | 2,500 MPa |
| Instantaneous displacement limit | 0.150 mm at 13,500 N |
The model assumes centered axial force, parallel faces, and uniform nominal contact.
At normal load: σc = 9,000 / 900 = 10.00 MPa.
At maximum load: σc = 13,500 / 900 = 15.00 MPa.
These values describe nominal engineering stress, not measured material yield or compressive strength.
7.2. Predicted Axial Shortening Against the Design Limit
Using the assumed linear elastic modulus Ec = 2,500 MPa:
δ = FL₀ / (A₀Ec) = (13,500 × 20) / (900 × 2,500) = 0.1200 mm.
εc = (0.1200 / 20) × 100% = 0.600%.
The limit of 0.150 mm corresponds to 0.750% strain over the nominal 20 mm length.
| Design check | Calculated result | Target | Assessment |
| Maximum force | 13,500 N | 13,500 N | Input |
| Nominal compressive stress | 15.00 MPa | No material limit established | Material verification needed |
| Instantaneous shortening | 0.1200 mm | ≤ 0.150 mm | Calculation meets target |
| Engineering strain | 0.600% | ≤ 0.750% | Calculation meets target |
| Cracking or crushing | Not determined | No unacceptable damage | Physical inspection needed |
| Sustained-load deformation | Not determined | Service limit required | Creep assessment needed |
The predicted displacement is 0.0300 mm below the instantaneous limit. This is a model-specific displacement difference, not a strength safety factor or a validated creep allowance.
7.3. What Must Be Verified Before Part Approval?
Material identity and properties. Establish batch-linked evidence for the specified TECAFORM AH natural stock and its orientation. Confirm whether the 2,500 MPa model modulus is appropriate using grade-specific data or relevant compression tests. Document actual ASTM D695-26 test geometry, orientation, conditioning, speed, and strain measurement if that method is used.
Finished-part geometry and contact. Inspect real dimensions, bearing-face flatness and parallelism, edge condition, load alignment, and any localized contact concentration. Nominal area cannot substitute for actual contact assessment.
For CNC-machined spacers, tight tolerance machining should prioritize bearing-face flatness, parallelism, and dimensions that control the actual contact and load path.
Functional testing. Reproduce the loading and bearing configuration; record actual force and corrected displacement, inspect damage and recovery after unloading, and define a sustained-load or creep check when required by the service envelope. Production geometry can be checked through functional prototype testing.
7.4. Engineering Decision
The nominal geometry and linear elastic inputs predict 0.1200 mm shortening at 13,500 N, satisfying the 0.150 mm calculation target. The case record does not establish a measured modulus, actual finished-part displacement, yield strength, or long-term creep response. This supports preliminary geometry assessment but not unconditional production release.
8. Compression Test Data Review Checklist
Before approving a plastic component using supplier compression data, identify the test method and determine whether the specimens, material and conditions represent the proposed part.
| Review item | What to verify | Why it matters |
| Material identity | Exact grade, source, reinforcement, batch | Formulations differ |
| Test method | Standard and edition | Definitions and procedures differ |
| Specimens | Geometry, dimensions, orientation, preparation | Can change measured response |
| Conditioning | Temperature, humidity, duration | Affects plastic behavior |
| Loading speed | Actual rate and material specification | Rate-dependent response |
| Strain measurement | Gauge length, instrument, correction | Modulus sensitivity |
| Property definition | Modulus, yield, maximum stress, specified-strain stress | They are not synonyms |
| Raw results | Individual curves, validity and statistics | Reveals variability and failure modes |
| Actual geometry | Contact face and local load path | Nominal stress may mask concentration |
| Service envelope | Temperature, time, cycling, displacement | Short-term results may be insufficient |
| Acceptance evidence | Functional tests, inspection, limits | Coupon data do not approve finished parts |
8.1. Questions to Resolve Before Approving a Supplier’s Data
For a compression spacer, check the bearing area and axial displacement limit. For a mounting boss, examine local pressure and permanent deformation. A slender support may require a separate stability analysis.
Do not compare ASTM D695-26 and ISO 604:2002 compression moduli only because both are in MPa. Verify material grade, orientation, specimen condition, test procedure, and property definition. Cross-process transfer requires special scrutiny. Related specifications appear in engineering material properties and DFM guidelines for bearing surfaces.
8.2. Define Acceptance Before Testing
For the POM-C spacer, the design specifies 13,500 N and 0.150 mm maximum instantaneous shortening. The linear model predicts 0.1200 mm, but the actual component must still demonstrate the required displacement, recovery, contact condition, and sustained-load behavior. Define measurement methods, hold duration, and acceptance thresholds before testing. Nominal stress below a published material strength is not by itself evidence of functional acceptance.
9. Frequently Asked Questions
9.1. Is Compressive Stress the Same as Compressive Strength?
No. Compressive stress is force divided by original load-bearing area. Compressive strength is the maximum engineering stress reported in a defined material compression test. A component’s nominal stress alone does not establish whether it will yield, crack, crush, or buckle.
9.2. Can Tensile Strength Be Used to Estimate Compressive Strength?
Not without a justified material model or suitable test evidence. Plastics may behave differently under tension and compression because of molecular orientation, reinforcement, processing, and deformation mechanisms. Use properties relevant to compression loading.
9.3. Does a Higher Compressive Modulus Mean a Stronger Plastic?
No. Modulus measures stiffness in compression. Compressive strength describes the maximum engineering stress reached under specified conditions. A stiffer material does not necessarily have a higher yield or maximum compressive strength.
9.4. Can ASTM D695 and ISO 604 Compression Test Results Be Compared Directly?
Not on the property name alone. The methods have different modulus determination procedures, and specimen, loading, conditioning, and measurement conditions must be checked. Compare exact grades, orientation, measured property definitions, and test conditions before drawing conclusions.
9.5. Why Can a Plastic Part Fail Below Its Published Compressive Strength?
Published compressive strength describes material response under specified test conditions. A finished part may suffer local crushing, permanent deformation, cracking, buckling, or excessive creep at a lower nominal stress because of geometry, contact, process history, loading duration, and temperature.
Ready to Quote Your CNC Prototype?
Upload your STEP file and get a DFM review + quote within 12 hours.
No tooling cost. Minimum 1 part.