

Dewey Wu General Manager & senior mechanical engineer at EPOC CRAFTER, 15 years in design engineering, quality, and metallurgy. Hands-on across CNC machining, metalwork, sheet metal, and prototyping (subtractive + 3D printing).
Stress and strain describe two parts of the same tensile response. Engineering stress is force divided by original cross sectional area. Engineering strain is change in gauge length divided by original gauge length. The stress strain relationship, often searched as the stress vs strain relationship, is useful only when you know how the tensile test was run. ASTM E8/E8M-25 and ISO 6892-1:2019 both cover room temperature tensile testing of metals, but specimen geometry, sampling direction, gauge length, strain measurement, and test rate affect the reported result. A stress strain curve can support material selection and mill test report review, but it does not by itself define the allowable load of a finished part.
1. Stress vs Strain: What Is Stress and Strain?
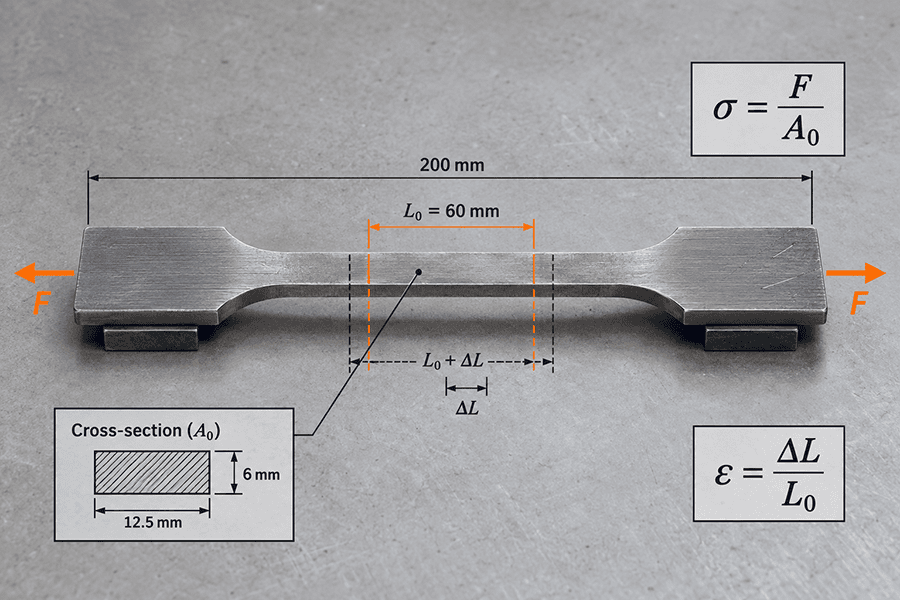
The stress vs strain difference is simple. Stress describes load intensity. Strain describes deformation. The stress formula for engineering tensile stress is σ = F/A₀. The strain formula is ε = ΔL/L₀. This stress strain equation uses the specimen dimensions established before loading. Read stress and strain together when you compare material behavior, because force alone does not show deformation and deformation alone does not show the load that caused it.
| Item | Stress | Strain | Engineering decision |
| Meaning | Force carried per original cross sectional area | Change in gauge length divided by original gauge length | Use both to describe tensile response |
| Expression | σ = F/A₀ | ε = ΔL/L₀ | Both use original specimen dimensions |
| Typical units | MPa or psi | mm/mm, in/in, or % | Do not compare values without checking the test basis |
| Main measurement | Test machine force system | Extensometer or permitted gauge measurement | Strain measurement quality matters near yield |
| Key limit | Original area remains the reference after necking | Crosshead travel is not automatically specimen strain | Engineering values are not true stress and true strain |
Source basis: ASTM E8/E8M-25 Scope and tensile test definitions; ISO 6892-1:2019 room temperature tensile testing terminology.
ASTM E8/E8M-25 treats tensile stress and strain as specimen based results. Crosshead travel is not automatically specimen strain because machine compliance, grip seating, and deformation outside the gage section can be included in the movement measured by the machine.
2. Engineering Stress and Engineering Strain
2.1 What Is Engineering Stress?
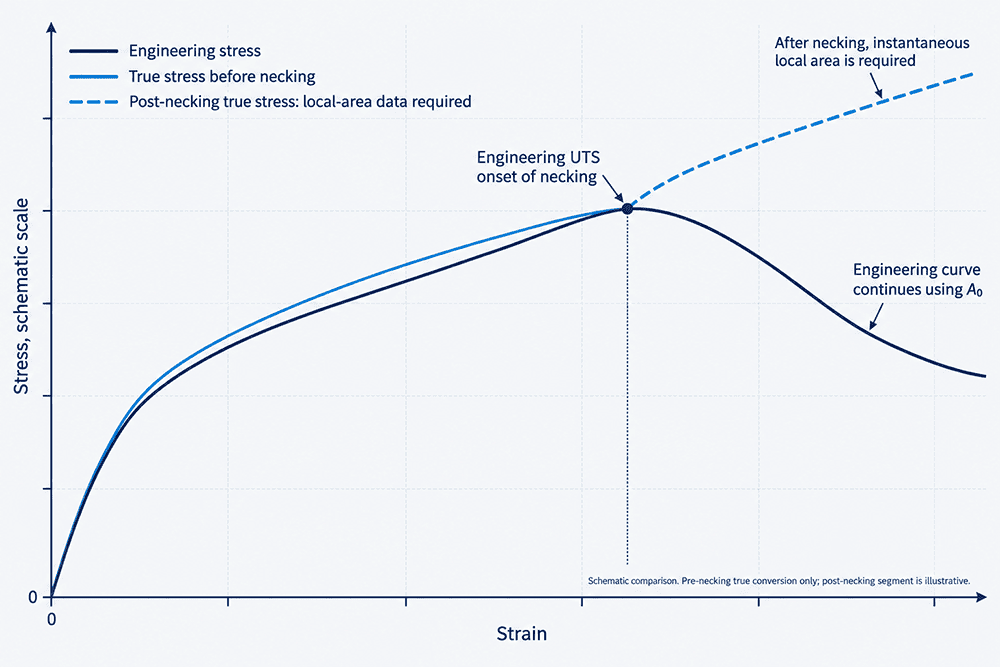
Engineering stress uses the original area A₀ throughout the calculation. This convention makes test data easy to compare for acceptance and material screening, but it becomes a limitation after necking because the local area is shrinking.
2.2 What Is Engineering Strain?
Engineering strain uses the original gauge length L₀. Gauge length affects elongation, so results based on 50 mm, 2 in, 4D, 5D, or another permitted specimen proportion are not automatically interchangeable. ASTM commonly uses the spelling gage length in its test language.
2.3 Engineering Stress vs True Stress
The engineering stress vs true stress distinction is the reference area. True stress uses the instantaneous area. The engineering strain vs true strain distinction follows the same principle for length. ASTM E8/E8M-25 conventional results should not be presented as though the standard automatically supplies a true stress strain curve. After necking, a falling engineering stress does not prove that local true stress is falling.
3. How to Read a Stress Strain Curve and the Stress vs Strain Relationship
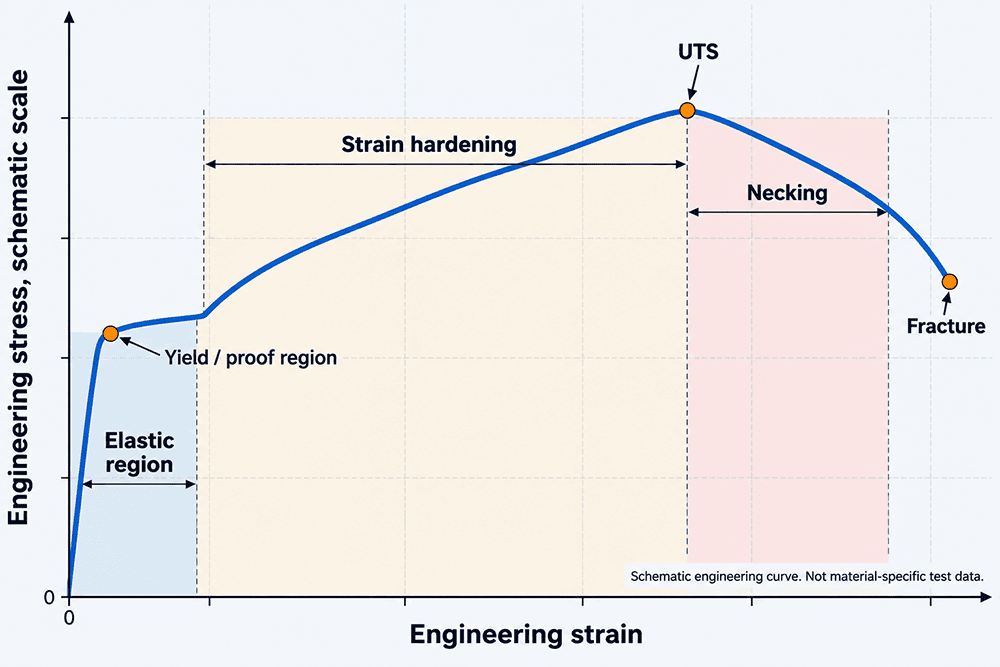
A stress vs strain curve, stress vs strain graph, or stress strain diagram is useful when each feature is tied to a specific decision. A stress strain curve explained for manufacturing should connect each feature to a test condition or design decision. An engineering stress strain curve should not be reduced to one strength number.
3.1 Elastic vs Plastic Deformation
In the elastic region, many metals show an approximately linear response. The proportional limit marks the end of strict proportionality. The elastic limit concerns recovery without permanent set. Once permanent set remains after unloading, plastic deformation has begun. This elastic deformation and plastic deformation boundary often matters more to a machined part than the fracture point.
3.2 Yield Point, Proof Strength and the 0.2% Offset Method
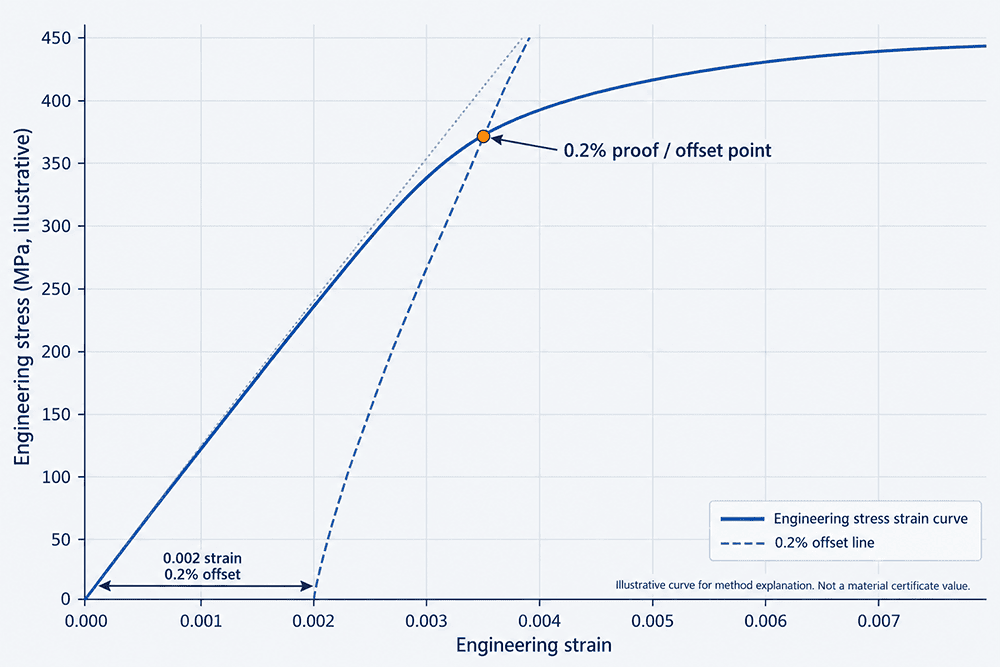
Some steels show a distinct yield point with upper yield strength, lower yield strength, and yield point elongation. Other metals are commonly evaluated with proof strength. For a 0.2 offset yield strength, the offset is 0.002 strain. ISO 6892-1 uses Rp0.2 for proof strength at 0.2% plastic extension. ReH, ReL, Rp, and Rt are separate ISO terms and should not be rewritten as one generic yield value.
3.3 Tensile Strength, Elongation and Ductility
Tensile strength, or UTS, is the maximum engineering stress. The tensile strength vs yield strength distinction is functional: yield or proof behavior marks specified permanent deformation, while UTS marks the maximum engineering tensile stress. The same point applies when a user searches yield strength vs tensile strength.
How is tensile strength measured? Under ASTM E8/E8M, tensile strength is based on the maximum test force divided by the original cross sectional area. Ductility needs separate measures. Elongation, elongation at break, percent elongation, and reduction of area do not mean the same thing. Material ductility should be compared on a common specimen and gauge length basis.
| Curve feature | What it means | Useful for | Do not infer |
| Elastic region | Recoverable response before permanent set | Elastic response and stiffness screening | Finished part capacity |
| Yield point or proof strength | Defined onset of yield or specified plastic extension | Permanent set limit under the test | UTS or fatigue life |
| UTS | Maximum engineering tensile stress | Strength comparison under monotonic tension | Allowable working stress |
| Elongation | Extension over the reported gauge length | Ductility comparison on the same basis | Local necking alone |
| Reduction of area | Local contraction at fracture | Localized ductility | Total elongation over the gauge section |
Source basis: ASTM E8/E8M-25 definitions for yield, tensile strength, elongation and reduction of area; ISO 6892-1:2019 terminology for ReH, ReL, Rp, Rp0.2, Rt and Rm.
A steel stress strain curve may show a clear yield plateau, while an aluminum stress strain curve often relies on proof strength. This difference becomes especially clear when comparing how cast iron and steel behave under load, because brittle and ductile materials do not share the same yield behavior. The mechanical behavior of materials changes with material family and condition, so a metal stress strain curve should be interpreted through the applicable product specification and test method rather than by shape alone. For aluminum, 6061 T6 vs T651 vs T6511 tempers can differ in strength, residual stress, and manufacturing condition, so temper should be checked before comparing tensile data.
4. Why Two Tensile Curves From the Same Alloy Can Differ
Two curves from the same nominal grade are not automatically comparable. Check the tensile specimen, product form, sampling direction, heat treatment, thickness, gauge length, extensometer method, alignment, gripping, strain measurement, and strain rate before you attribute the difference to material quality.
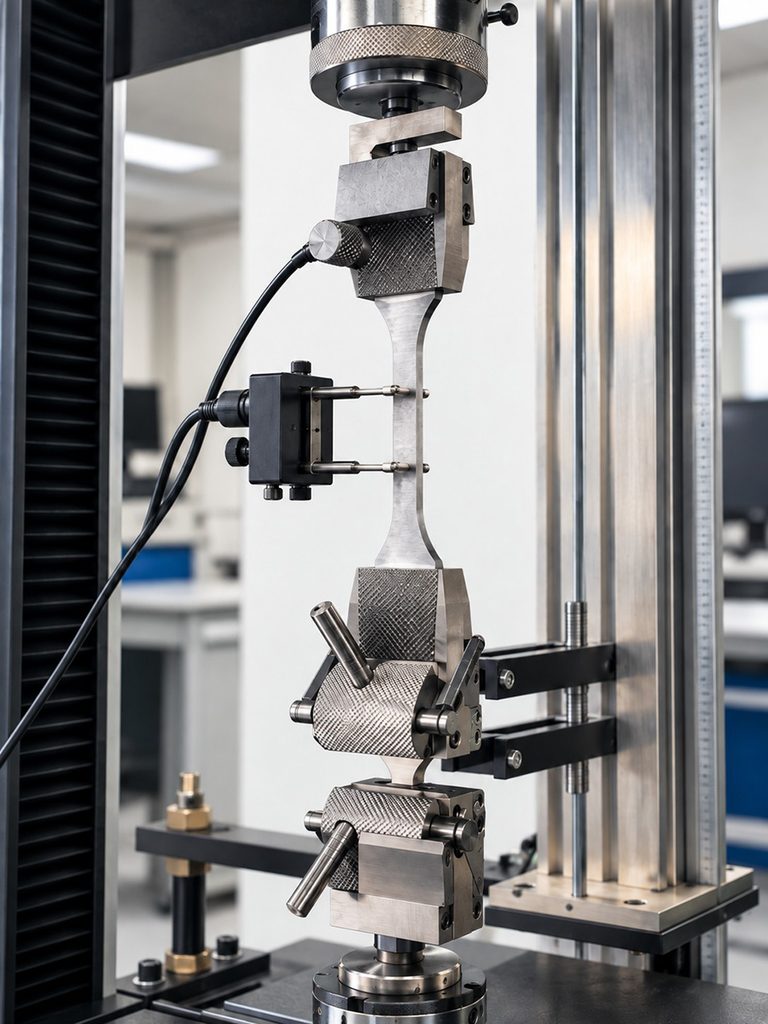
An extensometer tensile test measures strain over a defined gauge section. Crosshead displacement can include compliance in the machine and grips. ASTM E8/E8M also identifies misalignment, grip slippage, poor specimen transitions, and test rate as sources that can affect the curve.
The same rule applies to a tensile test specimen cut from plate, bar, tube, or forging. Rolling direction, forging flow, radial position, and through thickness location can change the result. Heat treatment and batch condition add another source of variation. This effect is particularly important for alloy steels, where 4140, 1045 and 1018 can differ substantially in strength response because composition and heat treatment condition are not equivalent. The EPOC CRAFTER heat treatment before or after CNC machining guide explains why the delivered condition must match the design assumption when thermal processing changes hardness and strength.
| Check | Why it changes comparability | What to verify |
| Specimen geometry | Changes area, elongation basis and fracture behavior | Round, rectangular, full section or subsize specimen |
| Gauge or gage length | Changes elongation basis | Reported gauge length and specimen proportion |
| Product form and direction | Wrought products can be direction dependent | Plate, bar, tube or forging and sampling orientation |
| Extensometer and alignment | Affects early slope and yield measurement | Strain system, gripping and axial alignment |
| Strain rate | Can affect yield and elongation | Control method and applicable test rate |
| Heat treatment and batch | Changes mechanical condition | Temper, heat treatment, heat or lot identity |
| Test standard | ASTM and ISO use different terminology and procedures | ASTM E8/E8M-25 or ISO 6892-1:2019 as specified |
Source basis: ASTM E8/E8M-25 specimen, measurement and rate controls; ISO 6892-1:2019 Method A and Method B rate control framework.
5. How to Read Stress Strain Data on an MTR or Material Certificate
A mill test report is batch specific evidence. A material datasheet usually gives typical values, specification values, or both. Do not treat them as interchangeable. Start with identity: grade, product form, heat or lot, delivered condition, governing material specification, tensile test method, and sampling direction when reported. Then compare the measured result with the actual acceptance requirement.
Terminology also matters. Yield stress vs yield strength wording can vary across supplier documents, so keep the property name tied to the governing standard and purchase requirement.
A material test report or mill test certificate can support acceptance only for the heat or lot it represents. Published typical values remain useful for screening. The EPOC CRAFTER metal strength chart for CNC materials separates published typical values from guaranteed requirements, while the materials and properties reference helps compare stock choices before supplier certificates are available.
| MTR field | What it tells you | Decision use |
| Material specification and grade | Identity and governing requirements | Confirm the certificate matches the ordered material |
| Product form and condition | Stock form, temper or heat treatment state | Check that the tested condition matches the design assumption |
| Test standard | How the tensile result was generated | Keep ASTM and ISO terminology tied to the stated method |
| Yield or proof term | Yield, ReH, ReL, Rp0.2 or other specified value | Compare the property required by the purchase specification |
| Tensile strength | Maximum engineering tensile stress | Use for monotonic tensile strength comparison, not finished part allowable |
| Elongation and gauge length | Ductility on the reported specimen basis | Compare only on a compatible gauge length and specimen basis |
| Heat or lot | Traceability to the tested batch | Do not extend one batch result to every future delivery |
Source basis: ASTM E8/E8M-25 acceptance use and specimen based tensile results; the governing product specification or purchase requirement sets the actual acceptance limits.
6. Using Stress Strain Data for Material Selection
Material selection starts by asking which property controls the part. Stiffness vs strength is not the same decision. Stiffness concerns elastic deformation. Yield concerns permanent set. UTS concerns maximum engineering tensile stress. The same distinction becomes practical when comparing high specific strength materials such as Ti-6Al-4V with 316L stainless steel, where strength, stiffness, density and application requirements must be evaluated separately. Stress vs strength is also different: stress is a load response in the part or specimen, while strength is a material property measured under defined conditions.
For a deeper strength comparison, the EPOC CRAFTER yield strength vs tensile strength guide keeps yield and UTS separate and ties both to CNC part selection.
A tensile coupon is not a finished part. Holes, threads, shoulders, thin walls, fillets, residual stress, surface condition, assembly preload, and service temperature change the local stress state. ASTM E8/E8M-25 does not provide finished part allowable stress, fatigue life, creep life, shear strength, or compression strength.
Use published values to narrow the shortlist, then verify the governing specification and delivered certificate. Once the required strength and stiffness range is established, a broader CNC machining materials comparison can be used to evaluate machinability, corrosion behavior and finished-part cost among eligible alloys. The DFM design guidelines connect material properties to geometry and manufacturability, while the CNC machining capability page shows where stock form, tolerance and process route enter the production decision.
7. What Stress Strain Data Does Not Tell You
A room temperature tensile test does not establish fatigue life, creep life, fracture toughness, shear capacity, compression behavior, or the load capacity of a finished component. It also does not guarantee that one test specimen represents every direction, thickness, heat treatment condition, or product form.
Use tensile data when monotonic tensile behavior is relevant. Use the test method and property that match the actual failure mode when fatigue, creep, shear, compression, or crack growth controls. For components controlled by transverse loading, pins, bolts or shafts, the separate shear stress calculation and failure-mode checks are more relevant than a uniaxial tensile curve alone. Drawing acceptance is a separate question. The EPOC CRAFTER tolerances and engineering standards reference covers dimensional and geometric requirements that a material certificate cannot prove.
8. FAQ
8.1 Are Manufacturer Datasheet Values Engineering Stress or True Stress?
For tensile properties reported under ASTM E8/E8M, engineering stress is the reporting basis. For an unspecified datasheet, check the cited test method instead of assuming. Engineering stress uses original area, while true stress requires instantaneous area.
8.2 How Is a Stress Strain Curve Developed in the Lab?
A universal testing machine loads a standardized tensile specimen while force and extension or strain are measured. Engineering stress comes from force divided by original area. Engineering strain comes from extension divided by original gauge length. The control method and extensometer setup matter near yield.
8.3 Why Can Two Stress Strain Curves for the Same Material Be Different?
The grade name is not enough. Product form, tensile specimen geometry, orientation, heat treatment, gauge length, strain measurement and strain rate can all change the reported curve. Compare the test basis before you compare the numbers.
8.4 Can a Force Versus Length Graph Be Read Like a Stress Versus Strain Graph?
No. Force and extension are specimen dependent. Stress and engineering strain normalize those measurements by original area and original gauge length, which is why a force versus length plot cannot be read as material stress and strain without the geometry conversion.
8.5 What Gauge Length Should I Use for a Stress Strain Curve?
Use the gauge length required by the governing test standard and specimen type. ASTM E8/E8M-25 states that most round E8 specimens use 4D and most round E8M specimens use 5D. Do not mix the two specimen systems or compare elongation values without checking the reported gauge length.
For procurement, compare the test basis before you compare the values. For design, treat tensile data as one material input and reconnect it to part geometry, load path, manufacturing condition, and the governing acceptance criteria.
Ready to Quote Your CNC Prototype?
Upload your STEP file and get a DFM review + quote within 12 hours.
No tooling cost. Minimum 1 part.